
In March 2021, the Dutch Kadaster published the 3D Basisvoorziening, which is 3D data representing the Netherlands. The data is to be updated every year. There are 3 main datasets:
- 3D Basisbestand Volledig, describing terrain, water, roads, buildings (CityJson)
- 3D Basisbestand Gebouwen, describing buildings (CityJson)
- 3D Hoogtestatistieken Gebouwen, an approximate 2.5 D description of buildings (Geopackage)
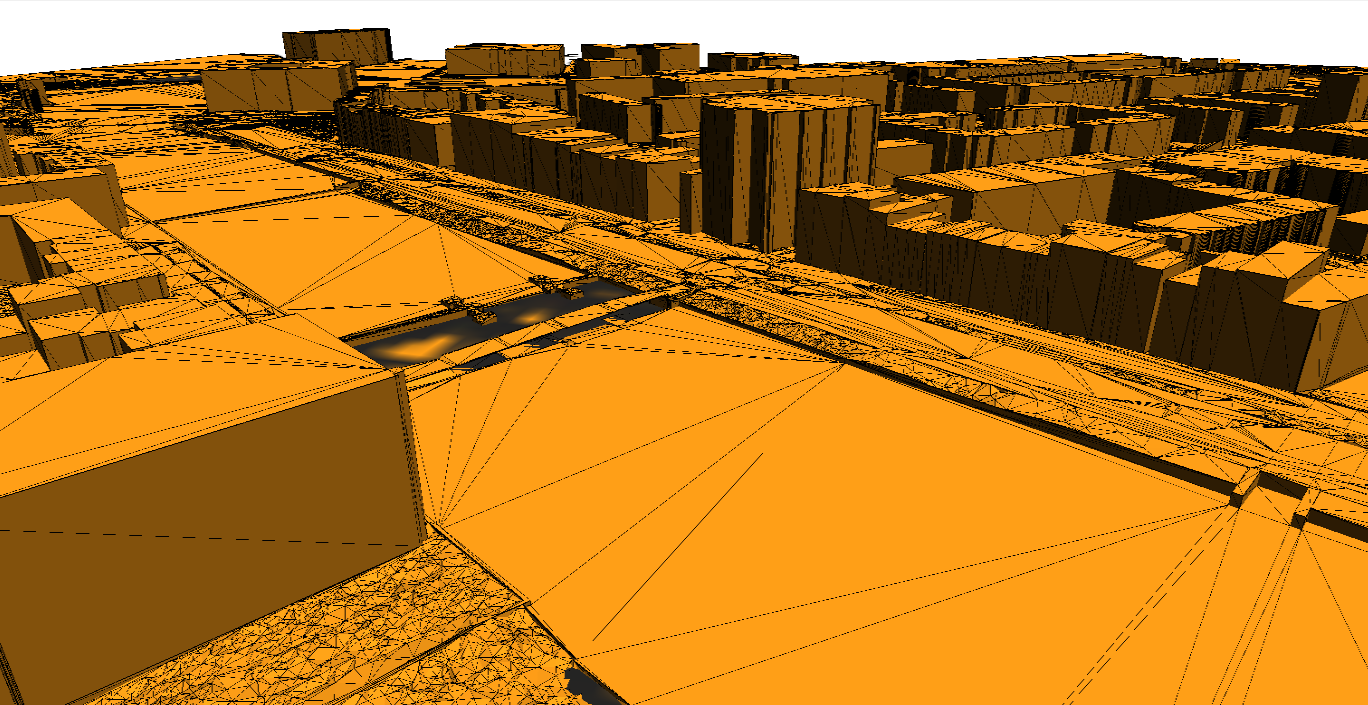
How can we use this data? On the download page, https://3d.kadaster.nl/basisvoorziening-3d/, we can choose to download data formatted as CityJson or Geopackage. CityJson is a JSON encoding for 3D city models using the CityGML 2.0 data model. The CityJson datasets are quite large and can only be downloaded per map sheet ('kaartblad'). Once downloaded you need a viewer to view the data. QGis has a CityJson loader plugin. After some huffing and puffing, a first import into the 3D Map looks like this:
The 3D data published by the Kadaster is created by a team from TU Delft. They provide even more detailed 3D datasets at better levels of detail (LOD). For reference, Levels of Detail (LOD) are explained in the image below:

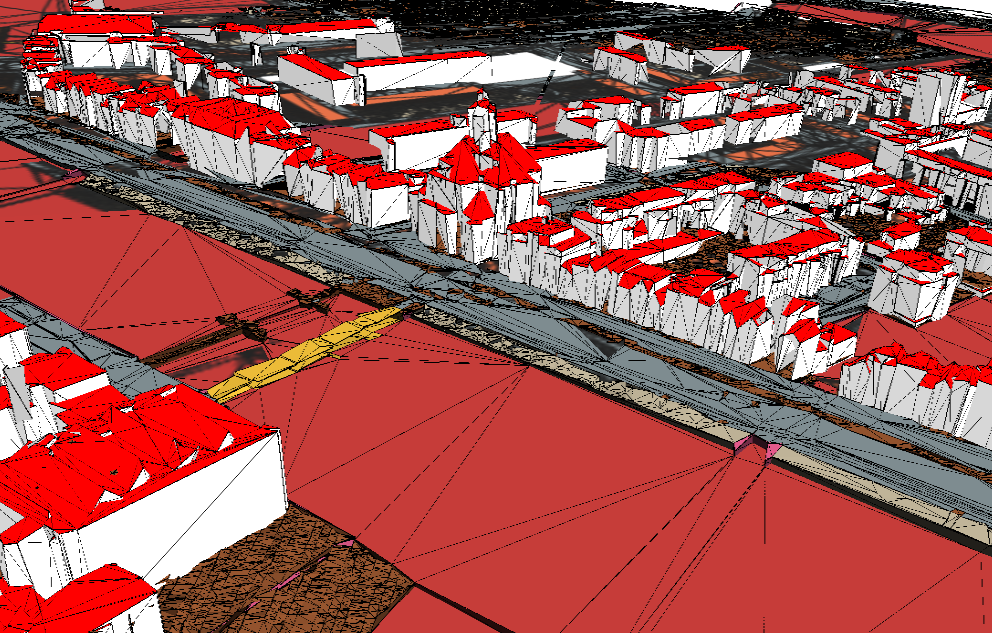
After downloading the LOD2 buildings from https://3dbag.nl/en/download and some tinkering, and lots of waiting, the QGIS 3D map view gets somewhat better:
Unfortunately, the more the detail, the larger the datasets. At larger datasets the 3D performance of QGIS comes to almost a standstill. I suppose this has to do with the way QGIS handles the data. All data seems to be loaded into memory and is reprocessed at every pan or zoom or pitch. This becomes especially a problem when we try to load nationwide datasets. PostGIS, our open source spatial database, may come to the rescue here. PostGIS is able to index data and extract only data that is in view. When combined with the concept of data tiles, the performance might become even better.
Geodan has some beautiful and fast demos that show the full glory of 3D data. These demos require a lot of preparation and computing resources. When browsing the available data I ran into file '3D Hoogtestatistieken Gebouwen' which is a nationwide dataset of only 1.9 GByte (zipped). Although not as fancy as the above demos, I decided to have a look at the possibilities for this file.
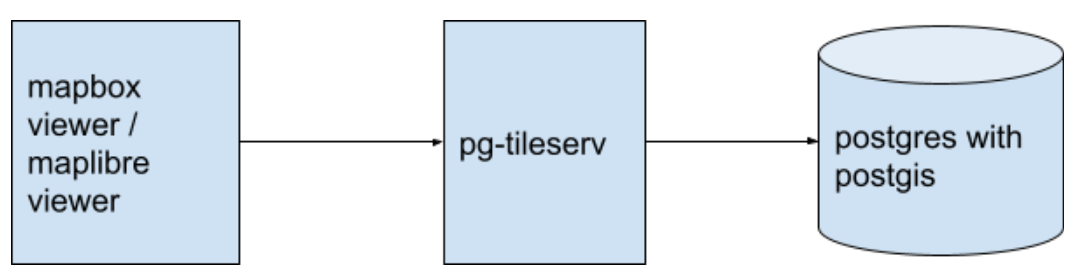
I wanted to create an interactive demo that should be relatively easy to replicate. Another requirement was user friendlyness. For ease of use, users should not have to install any software or data. A web-based demo viewer would be the obvious choice. Current popular options for 3D web mapping are Mapbox and Cesium. The following setup should be relatively quick to prepare (if you have postgis running somewhere).
File '3D Hoogtestatieken Gebouwen' contains detailed height information for all buildings in the Netherlands. The image below shows that the detail of the data is somewhere between LOD1 and LOD2. The producers call it LOD1.2 or LOD1.3, which indicates that sub-building details are added (LOD2/LOD3), but pitched surfaces (pitched roofs) are not available(LOD1). In this case, in stead of true 3D data, the building parts are 2D surfaces that are vertically 'extruded' by inspecting the height attribute for each part.
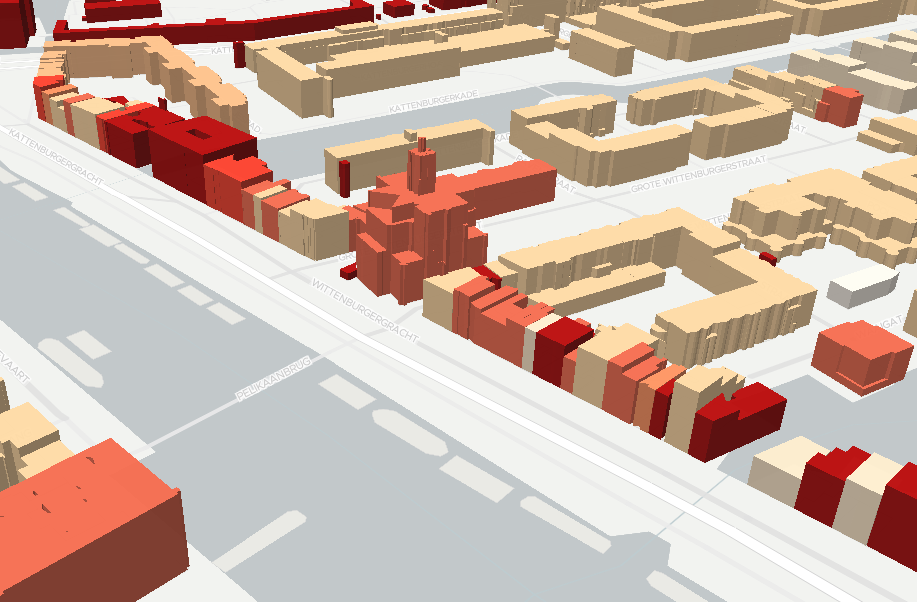
The '3D Hoogtestatistieken Gebouwen' dataset has many more attributes, such as the building id ('bagid') and the the year of construction ('bouwjaar'). The colors of the buildings in the demo depend on this attribute. Darker colored buildings are older. The id attribute 'bagid' can be used to join many more attributes available in other building datasets that usually come with the same building id.
The interactive demo at the bottom of this article can be reproduced in 5 steps. Prerequisites for this setup are the availability of Postgres/PostGIS, a tool to import external data into PostGIS (such as ogr2ogr) and the possibility to install the pg-tileserv software, for instance through Docker.
Installation steps:
- download the 'landsdekkende' dataset 3D Hoogtestatieken Gebouwen (GeoPackage) from https://3d.kadaster.nl/basisvoorziening-3d/
- unzip the downloaded zip file 2019_3d_hoogtestatistieken_gebouwen.zip. This results in file 2019_NL_3d_hoogtestatistieken_gebouwen.gpkg. This geopackage file contains 1 layer: bag13_lod1213_2d_levering
- import this layer into postgres/postgis database with for example the gdal tool 'ogr2ogr'
ogr2ogr -f "PostgreSQL" PG:"host=database.host.name user=dbuser dbname=databasename password=xxxx" -nlt PROMOTE_TO_MULTI -overwrite -lco GEOMETRY_NAME=geom -lco precision=NO -nln public.bag13_lod1213_2d_levering "3d_hoogtestatistieken_gebouwen.gpkg" "bag13_lod1213_2d_levering"4. start a tile server, for example pg-tileserv
docker run -it --rm -e DATABASE_URL=postgresql://dbuser:dbpassword@database.host.name/dbname --network host pramsey/pg_tileserv:latest(replace '-it' by '-id' to start pg-tileserv as a daemon in the background)
5. copy file 3dbuilding.html from
https://saturnus.geodan.nl/mapbox-viewer/3dbuilding.html
and replace the bold part in line:
tiles:["https://research1.geodan.nl/anneb.bag13_lod1213_2d_levering/{z}/{x}/{y}.pbf"],
by the URL of your pg-tileserv instance
Interactive demo, go to any location in the Netherlands and click a building for building attributes.